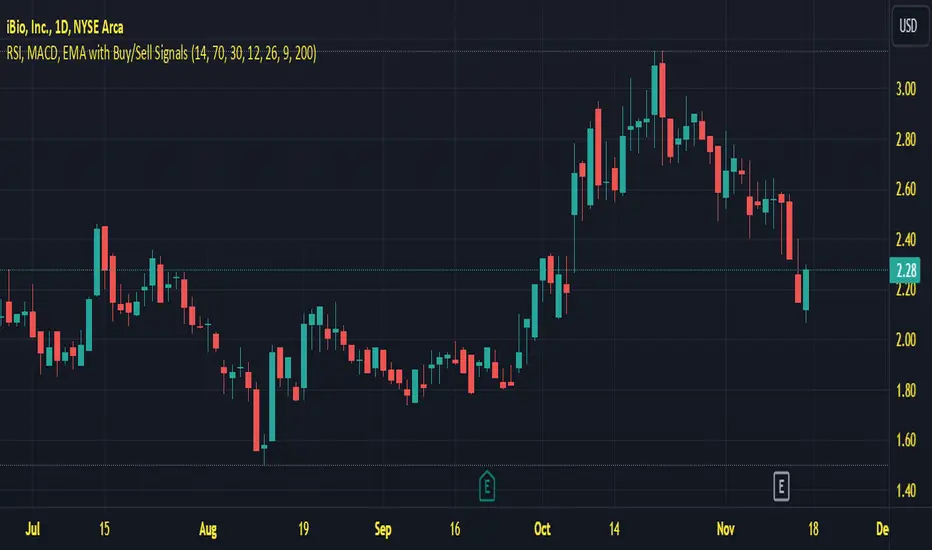
Last Freemans Ver1This script is a technical indicator for TradingView that combines three popular tools for analyzing price movements:
Relative Strength Index (RSI): This measures the momentum of recent price changes and indicates potential overbought or oversold conditions. The script allows you to adjust the RSI length (default 14) and define overbought (default 70) and oversold (default 30) levels.
Moving Average Convergence Divergence (MACD): This indicator helps identify trend direction and potential turning points. It uses two moving averages (fast and slow) and a signal line. The script lets you customize the lengths of the MACD lines (fast: 12, slow: 26, signal: 9).
Exponential Moving Average (EMA): This is a smoothing indicator used to identify the underlying trend by filtering out price noise. You can adjust the EMA length (default 200) in the script.
Additionally, the script generates Buy/Sell signals based on the following conditions:
Buy Signal:
MACD line crosses above the signal line (indicating a potential uptrend).
RSI is below the oversold level (suggesting room for price increase).
Closing price is below the EMA (potentially indicating a price pullback before an upswing).
Sell Signal:
MACD line crosses below the signal line (indicating a potential downtrend).
RSI is above the overbought level (suggesting potential for a price decrease).
Closing price is above the EMA (potentially indicating a price breakout before a decline).
Visualization:
The script plots the following on the chart:
RSI line (blue) with overbought and oversold levels as dashed lines (red and green, respectively).
MACD line (red) and signal line (blue).
EMA line (orange).
Green triangle up (below the bar) for Buy signals.
Red triangle down (above the bar) for Sell signals.
Important Note:
This script provides trading signals based on technical indicators, but keep in mind that these are not guaranteed predictions of future price movements. Always conduct your own research and consider other factors before making trading decisions.
"Relative Strength Index (RSI)" için komut dosyalarını ara
Gold Scalping Strategy with Precise EntriesThe Gold Scalping Strategy with Precise Entries is designed to take advantage of short-term price movements in the gold market (XAU/USD). This strategy uses a combination of technical indicators and chart patterns to identify precise buy and sell opportunities during times of consolidation and trend continuation.
Key Elements of the Strategy:
Exponential Moving Averages (EMAs):
50 EMA: Used as the shorter-term moving average to detect the recent price trend.
200 EMA: Used as the longer-term moving average to determine the overall market trend.
Trend Identification:
A bullish trend is identified when the 50 EMA is above the 200 EMA.
A bearish trend is identified when the 50 EMA is below the 200 EMA.
Average True Range (ATR):
ATR (14) is used to calculate the market's volatility and to set a dynamic stop loss based on recent price movements. Higher ATR values indicate higher volatility.
ATR helps define a suitable stop-loss distance from the entry point.
Relative Strength Index (RSI):
RSI (14) is used as a momentum oscillator to detect overbought or oversold conditions.
However, in this strategy, the RSI is primarily used as a consolidation filter to look for neutral zones (between 45 and 55), which may indicate a potential breakout or trend continuation after a consolidation phase.
Engulfing Patterns:
Bullish Engulfing: A bullish signal is generated when the current candle fully engulfs the previous bearish candle, indicating potential upward momentum.
Bearish Engulfing: A bearish signal is generated when the current candle fully engulfs the previous bullish candle, signaling potential downward momentum.
Precise Entry Conditions:
Long (Buy):
The 50 EMA is above the 200 EMA (bullish trend).
The RSI is between 45 and 55 (neutral/consolidation zone).
A bullish engulfing pattern occurs.
The price closes above the 50 EMA.
Short (Sell):
The 50 EMA is below the 200 EMA (bearish trend).
The RSI is between 45 and 55 (neutral/consolidation zone).
A bearish engulfing pattern occurs.
The price closes below the 50 EMA.
Take Profit and Stop Loss:
Take Profit: A fixed 20-pip target (where 1 pip = 0.10 movement in gold) is used for each trade.
Stop Loss: The stop-loss is dynamically set based on the ATR, ensuring that it adapts to current market volatility.
Visual Signals:
Buy and sell signals are visually plotted on the chart using green and red labels, indicating precise points of entry.
Advantages of This Strategy:
Trend Alignment: The strategy ensures that trades are taken in the direction of the overall trend, as indicated by the 50 and 200 EMAs.
Volatility Adaptation: The use of ATR allows the stop loss to adapt to the current market conditions, reducing the risk of premature exits in volatile markets.
Precise Entries: The combination of engulfing patterns and the neutral RSI zone provides a high-probability entry signal that captures momentum after consolidation.
Quick Scalping: With a fixed 20-pip profit target, the strategy is designed to capture small price movements quickly, which is ideal for scalping.
This strategy can be applied to lower timeframes (such as 1-minute, 5-minute, or 15-minute charts) for frequent trade opportunities in gold trading, making it suitable for day traders or scalpers. However, proper risk management should always be used due to the inherent volatility of gold.

RSI Buy/Sell SignalsThis Pine Script is designed to plot Buy and Sell signals based on the Relative Strength Index (RSI) for both 15-minute and hourly timeframes. It calculates the RSI values for the current 15-minute chart and requests the hourly RSI data for comparison. Buy signals are generated when the RSI crosses above 60 in either timeframe, while sell signals occur when the RSI crosses below 40. The script also plots visual markers on the chart, indicating buy signals with green labels below the price bars and sell signals with red labels above the price bars. Additionally, it allows for alert conditions, notifying the user when a buy or sell signal is triggered.

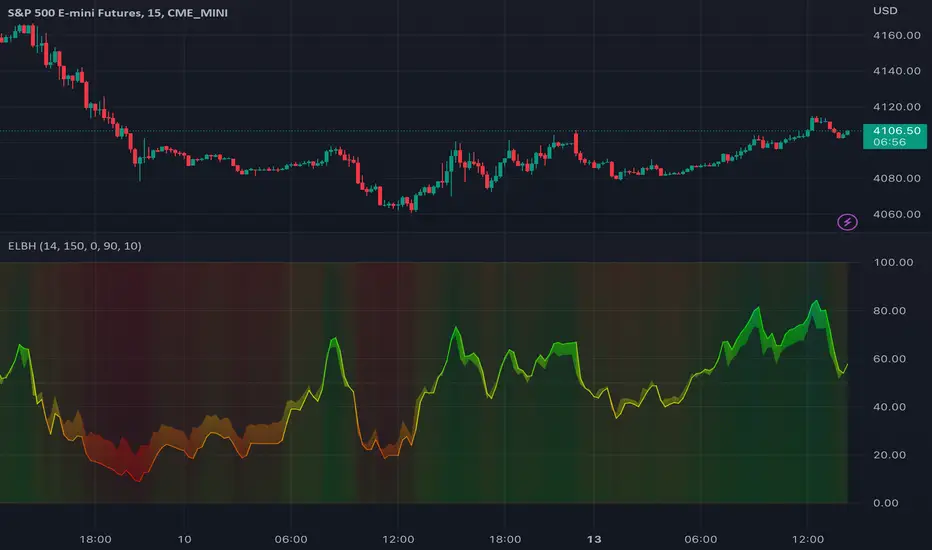
Bulls And Bears [CHE]This Pine Script™ indicator, Bulls And Bears , aims to provide traders with potential entry points by analyzing market conditions. Here's how it works:
Calculation of Maximum and Minimum Values: The script calculates the highest and lowest values based on the high, open, close, and low prices of the asset.
Relative Strength Index (RSI) Condition: It evaluates whether the RSI value (with a period of 14) is above 50, indicating bullish momentum.
Bullish and Bearish Conditions: Based on the calculated maximum and minimum values, along with the RSI condition, it determines bullish and bearish conditions. If the current maximum value is higher than the previous maximum and the RSI condition is met, it suggests a bullish condition. Conversely, if the current maximum value is lower than the previous maximum and the RSI condition is not met, it suggests a bearish condition.
Super Smoother Function: This function is used to calculate a smoother moving average, reducing noise in the data.
Input Parameters: Traders can adjust the "Length Difference" and "Length threshold" parameters to customize the indicator according to their trading preferences.
Calculation of Super Smooth Moving Averages: The script calculates super smooth moving averages for both bullish and bearish conditions.
Plotting: It plots the super smooth moving averages on the chart, indicating potential entry points for bullish (green) and bearish (red) conditions.
Filling Areas: It fills the areas between the moving averages and the threshold line based on the conditions. Green filling represents bullish conditions, while red filling represents bearish conditions.
By using this indicator, traders can potentially identify favorable entry points based on market conditions, helping them make informed trading decisions.

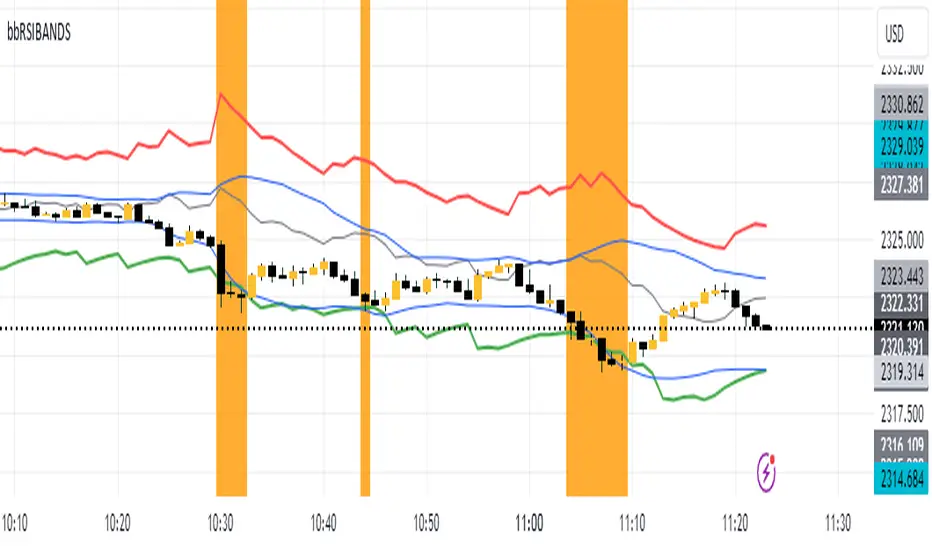
RSIBands with BBThis indicator combines three popular technical analysis tools:
RSI Bands: These bands are based on the Relative Strength Index (RSI) and visually represent overbought and oversold zones. The indicator plots upper and lower bands calculated using a user-defined RSI level and highlights potential buying and selling opportunities near these zones.
Bollinger Bands: These bands depict volatility with a moving average (basis line) and upper and lower bands at a user-defined standard deviation away from the basis line. Narrowing bands suggest potential breakouts, while widening bands indicate increased volatility.
Williams Fractals (with Confirmation): This custom function identifies potential reversal points based on price action patterns. The indicator highlights buy/sell signals when a confirmed fractal forms (previous fractal and price crossing a Bollinger Band).
Key Features:
User-defined parameters: You can adjust the RSI level, Bollinger Band standard deviation, and fractal period according to your trading strategy.
Visual confirmation: The indicator highlights confirmed buy/sell signals based on fractal patterns and price crossing Bollinger Bands.
Flexibility: This indicator provides a combination of trend, volatility, and reversal identification tools, allowing for a multi-faceted approach to technical analysis.
How to Use:
Add the indicator to your chart.
Adjust the RSI level, Bollinger Band standard deviation, and fractal period based on your preference.
Look for buy signals when a green background appears and there's a confirmed up fractal (upward triangle) with the price crossing above the upper Bollinger Band.
Look for sell signals when a red background appears and there's a confirmed down fractal (downward triangle) with the price crossing below the lower Bollinger Band.
Disclaimer:
This indicator is for informational purposes only and should not be considered financial advice. Always conduct your own research and due diligence before making any trading decisions.
RSI TrendsThis TradingView script combines RSI trend analysis with FVG (Fair Value Gap) detection to identify potential buy and sell opportunities in financial markets. The script is customizable and provides extensive visual feedback directly on the chart, enhancing both strategic entry and exit points for traders. Raw code of FVG was taken from LuxAlgo
Features
FVG Detection: Identifies Fair Value Gaps (FVG), and provides options to display these gaps based on user settings.
RSI Trend Bars: Utilizes the Relative Strength Index (RSI) to paint bars indicating overbought and oversold conditions. This helps traders understand current market sentiment and potential reversal points.
Customizable Settings: Users can customize the timeframe, FVG types, and RSI thresholds. This flexibility allows the script to be adapted to various trading styles and timeframes.
Historical Analysis: Option to display or hide historical FVGs, helping users analyze past market behavior without cluttering the chart.
Alert System: Integrated alerts for detected buy and sell signals based on RSI conditions and the presence or absence of FVGs. This feature notifies traders of potential trading opportunities.
Trading Signals
Buy, Buy+, and Buy++ Signals: These signals are triggered based on overbought conditions without corresponding bearish FVG presence, with increasing stringency for higher tiers of buy signals.
Sell, Sell+, and Sell++ Signals: These signals are based on oversold conditions devoid of bullish FVG presence, with each subsequent plus sign indicating a higher level of confirmation required to trigger the signal.
Use Case
Ideal for traders who rely on technical analysis and are looking for an automated way to spot potential buy and sell points using both price action gaps and momentum indicators.
Customization
All input parameters are adjustable directly from the indicator's settings panel, making it easy to tailor the tool to your trading needs and preferences.

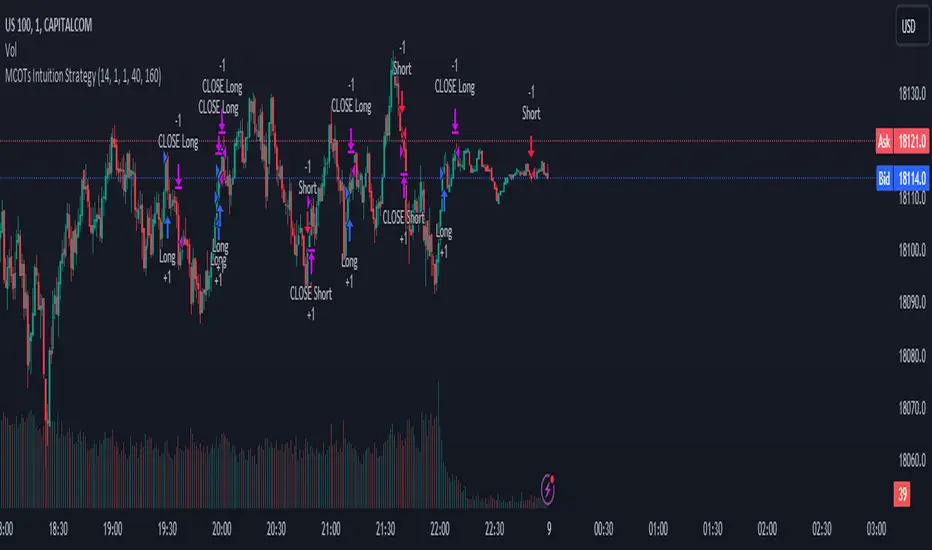
MCOTs Intuition StrategyInitial Capital: The strategy starts with an initial capital of $50,000.
Execution: Trades are executed on every price tick to capture all potential movements.
Contract Size: The default position size is one contract per trade.
Timeframe: Although not explicitly mentioned, this strategy is intended for a one-minute timeframe.
RSI Calculation: The Relative Strength Index (RSI) is calculated over a user-defined period (default is 14 periods).
Standard Deviation: The script calculates the standard deviation of the change in RSI values to determine the threshold for entering trades.
Exhaustion Detection: Before entering a long or short position, the script checks for exhaustion in the RSI’s momentum. This is to avoid entering trades during extreme conditions where a reversal is likely.
Entry Conditions: A long position is entered when the current RSI momentum exceeds the standard deviation threshold and is less than the previous momentum multiplied by an exhaustion factor. A short position is entered under the opposite conditions.
Limit Orders for Exit: Instead of traditional stop loss and take profit orders, the strategy uses limit orders to exit positions. This means the strategy sets a desired price level to close the position and waits for the market to reach this price.
Profit Target and Stop Loss: The script allows setting a profit target and stop loss in terms of ticks, which are the smallest measurable increments in price movement for the traded asset.
blah blah whatever
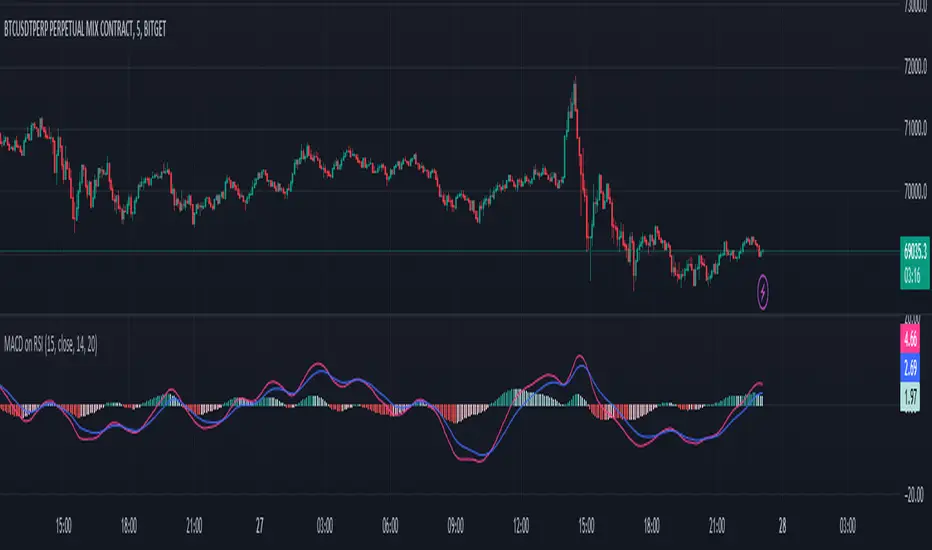
MACD on RSIThe MACD on RSI indicator combines elements of the Moving Average Convergence Divergence (MACD) and the Relative Strength Index (RSI). It calculates the RSI on a specified source with a customizable length, then applies two exponential moving averages (EMAs) to the RSI values. The difference between these EMAs forms the MACD line, visually representing the momentum of the RSI.
Gtrades Forex RSI & Volume SignalThe "Forex RSI & Volume Signal" indicator combines Relative Strength Index (RSI) and volume analysis to identify potential buy signals in forex trading. It calculates RSI to gauge overbought or oversold conditions, while comparing current volume to a moving average to determine bullish volume momentum. When RSI indicates oversold conditions and volume suggests bullish momentum, a buy signal is generated. This indicator aims to identify favorable entry points during short-term uptrends in the forex market, leveraging both momentum and volume analysis to inform trading decisions. It provides traders with a comprehensive tool to identify potential buying opportunities based on multiple technical factors.

Megabar Breakout (Range & Volume & RSI)Hey there,
This strategy is based on the idea that certain events lead to what are called Megabars. Megabars are bars that have a very large range and volume. I wanted to verify whether these bars indicate the start of a trend and whether one should follow the trend.
Summary of the Code:
The code is based on three indicators: the range of the bar, the volume of the bar, and the RSI. When certain values of these indicators are met, a Megabar is identified. The direction of the Megabar indicates the direction in which we should trade.
Why do I combine these indicators?
I want to identify special bars that have the potential to mark the beginning of a breakout. Therefore, a bar needs to exhibit high volume, have a large range (huge price movement), and we also use the Relative Strength Index (RSI) to assess potential momentum. Only if all three criteria are met within one candle, do we use this as an identifier for a megabar.
Explanation of Drawings on the Chart:
As you can see, there is a green background on my chart. The green background symbolizes the time when I'm entering a trade. Only if a Megabar happens during that time, I'm ready to enter a trade. The time is between 6 AM and 4 PM CET. It's just because I prefer that time. Also, the strategy draws an error every time a Megabar happens based on VOL and Range only (not on the RSI). That makes it pretty easy to go through your chart and check the biggest bars manually. You can activate or deactivate these settings via the input data of the strategy.
When Do We Enter a Trade?
We wait for a Megabar to happen during our trading session. If the Megabar is bullish, we open a LONG trade at the opening price of the next candle. If the Megabar is bearish, we open a SHORT trade at the opening price of the next candle.
Where Do We Put Our Take Profit & Stop Loss?
The default setting is TP = 40 Pips and SL = 30 Pips. In that case, we are always trading with a risk-reward ratio of 1.33 by default. You can easily change these settings via the input data of the strategy.
Strategy Results
The criteria for Megabars were chosen by me in a way that makes Megabars something special. They are not intended to occur too frequently, as the fundamental idea of this strategy would otherwise not hold. This results in only 37 closed trades within the last 12 months. If you change the criterias for a megabar to a milder one, you will create more Megabars and therefore more trades. It's up to you. I have adapted this strategy to the 30-minute chart of the EURUSD. In the evaluation, we consider a period of 12 months, which I believe is sufficient.
My default settings for the indicators look like this:
Avg Length Vol 20
Avg Multiplier Vol 3
Avg Length Range 20
Avg Multiplier Range 4
Value SMA RSI for Long Trades 50
Value SMA RSI for Short Trades 70
IMPORTANT: The current performance overview does not display the results of these settings. Please change the settings to my default ones so that you can see how I use this strategy.
I do not recommend trading this strategy without further testing. The script is meant to reflect a basic idea and be used as a tool to identify Megabars. I have made this strategy completely public so that it can be further developed. One can take this framework and test it on different timeframes and different markets.

SMA/EMA/RSImagic 36.963 by IgorPlahutaTwo Elements in this script:
Alerts: These are notifications that draw your attention to specific market conditions. There are two types:
RSI Higher Lows or Lower Highs: This alert triggers when the Relative Strength Index (RSI) forms higher lows or lower highs.
RSI Exiting 30 (Up) or RSI Exiting 70 (Down): These alerts activate when the RSI crosses the 30 threshold upwards or the 70 threshold downwards.
ALL BUY/SELL: to catch both of them with one setting
To Set Up an Alert: To configure an alert, select the one relevant to your trading strategy, choose the "Greater than" option, and input a value of "0" (this essentially activates the alert). Adjust other settings as per your requirements.
Please note that these alerts should be used in conjunction with a system you trust for confirmation.
Moving Averages: This involves monitoring several moving averages:
SMA12, SMA20, EMA12, EMA20: These moving averages are highlighted with background colors to help you quickly identify changes or crossovers. They are superimposed on each other for easy comparison.
SMA 50, SMA200: These moving averages are also highlighted with background colors to spot crossovers, and their lines change color depending on their direction (falling in red or rising in green).
Enjoy using these tools in your trading endeavors!

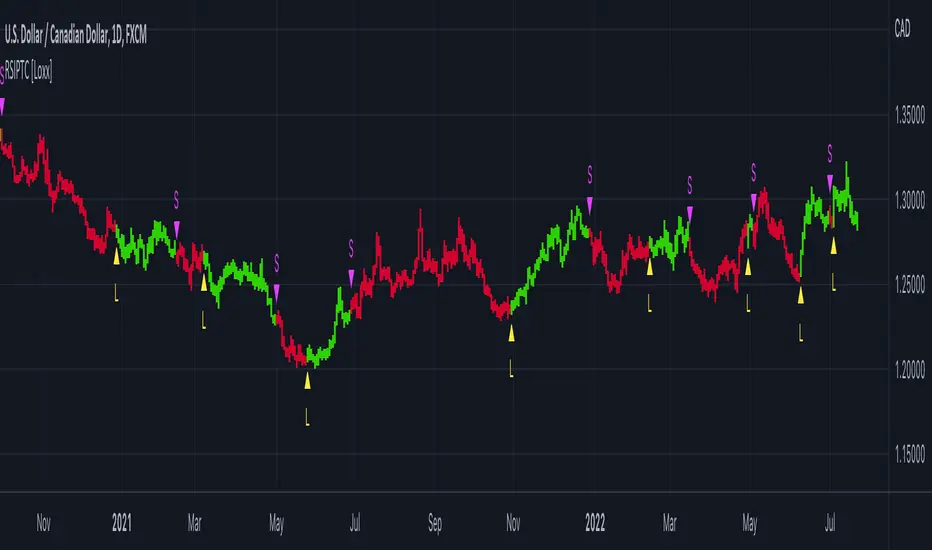
W and M Pattern Indicator- SwaGThis is a TradingView indicator script that identifies potential buy and sell signals based on ‘W’ and ‘M’ patterns in the Relative Strength Index (RSI). It provides visual alerts and draws horizontal lines to indicate potential trade entry points.
User Manual:
Inputs: The script takes two inputs - an upper limit and a lower limit. The default values are 70 and 40, respectively.
RSI Calculation: The script calculates the RSI based on the closing prices of the last 14 periods.
Pattern Identification: It identifies ‘W’ patterns when the RSI makes a higher low within the lower limit, and ‘M’ patterns when the RSI makes a lower high within the upper limit.
Visual Alerts: The script plots these patterns on the chart. ‘W’ patterns are marked with small green triangles below the bars, and ‘M’ patterns are marked with small red triangles above the bars.
Trade Entry Points: A horizontal line is drawn at the high or low of the candle to represent potential trade entry points. The line starts from one bar to the left and extends 10 bars to the right.
Trading Strategy:
For investing, use a weekly timeframe.
For swing trading, use a daily timeframe.
For intraday trading, use a 5 or 15-minute timeframe. Only consider sell-side signals for intraday trading.
Take a buy position if the high breaks above the green line or sell if the low breaks below the red line.
Use recent signals only and avoid signals that are too old.
Swing highs or lows will be your stop-loss level.
Always think about your stop-loss before entering a trade, not your target.
Avoid trades with a large stop-loss.
Remember, this script is a tool to aid in your trading decisions. Always test your strategies thoroughly before live trading. Happy trading! 😊

Philpose's Binary Turbo 1.2Hello there,
I'm thrilled to introduce my very first TradingView indicator - "Philpose's Binary Turbo 1.0." This indicator isn't just another tool; it's my unique take on binary options trading, powered by the Relative Strength Index (RSI).
Differences from Other Indicators:
This indicator is designed for traders who prefer short-term trading, as it uses a 1-minute timeframe.
It assumes that RSI crossovers of overbought and oversold levels can be used to generate binary options signals.
Users should backtest and evaluate the indicator's performance in different market conditions and consider risk management strategies.
Custom Logic: This indicator implements a custom trading logic based on RSI crossovers of overbought and oversold levels. Many indicators on TradingView use standard indicators, but this script incorporates unique logic.
Signal Tracking: It tracks and displays the last buy and sell signals on the chart. This visual representation can be helpful for traders to see when signals were generated.
Streak Tracking: The script keeps track of winning and losing streaks, which can provide traders with insights into their trading performance over time.
Table Summary: It creates a table summarizing various statistics related to the signals generated, such as total signals, wins, losses, and streaks. This tabular representation can be useful for traders to assess the indicator's performance.
How to Use:
To use this indicator effectively, follow these steps:
Add the Indicator: Copy and paste the script into TradingView's Pine Script editor. Then, apply the indicator to the chart.
Customize Parameters: Adjust the RSI parameters (period, overbought, and oversold levels) and the minimum bars between signals according to your trading strategy and preferences.
Interpret Signals: Buy signals are generated when the RSI crosses above the oversold level, and sell signals occur when it crosses below the overbought level.
Analyze Streaks: Keep an eye on the win and loss streaks to assess the indicator's performance and your trading strategy.
Review Table: The table at the top-right corner of the chart provides a summary of important statistics related to signals, wins, losses, and streaks.
Markets and Conditions:
The script can be used in various financial markets, including stocks, forex, commodities, and indices. However, it's important to note that binary options trading has a distinct risk profile and is available on certain platforms. Therefore, you should ensure that your chosen binary options platform supports TradingView indicators and that you understand the specific conditions of binary options trading.
Conditions for Use:
This indicator is designed for traders who prefer short-term trading, as it uses a 1-minute timeframe.
It assumes that RSI crossovers of overbought and oversold levels can be used to generate binary options signals.
Users should backtest and evaluate the indicator's performance in different market conditions and consider risk management strategies.
Please exercise caution when using any trading indicator or strategy, especially in binary options trading, as it involves a high level of risk, and you may lose your entire investment. It's advisable to thoroughly test any strategy on a demo account before trading with real funds and to seek the advice of a qualified financial advisor if you are unsure about your trading decisions.

Multiple Ticker Stochastic RSIThe Stochastic RSI is a technical indicator ranging between 0 and 100, based on applying the Stochastic oscillator formula to a set of relative strength index (RSI). Unlike the original Stochastic RSI indicator, this allows you to define up to two additional tickers for which all three will be averaged and outputted visually looking like a standard Stochastic RSI indicator. Potential buy and sell visuals are included, as well as alerts. Please note that this indicator is not meant to be used by itself.

12&50 RSI + %R2/50 RSI+ %R is a PineScript indicator that combines two popular technical indicators, the Relative Strength Index (RSI) and the Williams %R. The indicator plots two lines, K and D, which represent the smoothed moving averages of the RSI. It also plots the RSI with a 60-period length and the Williams %R with a 21-period length. The indicator can be used to identify overbought and oversold conditions, as well as potential reversals.
Here are some of the key features of the script:
It uses two different RSI lengths to provide a more comprehensive view of the market.
It plots the Williams %R, which can be used to identify overbought and oversold conditions.
It includes overbought and oversold levels to help traders identify potential entry and exit points.

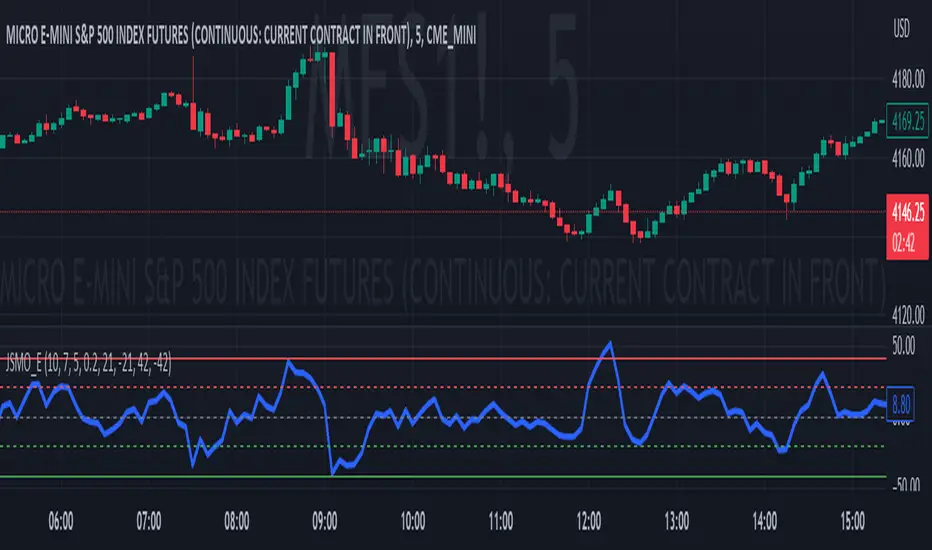
Jdawg Sentiment Momentum Oscillator EnhancedThe Jdawg Sentiment Momentum Oscillator Enhanced (JSMO_E) is a versatile technical analysis indicator designed to provide traders with insights into potential trend changes and overbought or oversold market conditions. JSMO_E combines the principles of the Relative Strength Index (RSI), the Simple Moving Average (SMA), and the Rate of Change (ROC) to create a comprehensive tool for assessing market sentiment and momentum.
The uniqueness of JSMO_E lies in its ability to integrate the RSI, SMA of RSI, and ROC of RSI, while also allowing users to customize the weight of the ROC component. This combination of features is not commonly found in other indicators, which increases its distinctiveness.
To effectively use JSMO_E, follow these steps:
Apply the JSMO_E indicator to the price chart of the asset you are analyzing.
Observe the plotted JSMO_E line in relation to the zero line, overbought, and oversold levels.
When the JSMO_E line crosses above the zero line, it may signal the beginning of an uptrend or bullish momentum. Conversely, when the JSMO_E line crosses below the zero line, it may indicate the start of a downtrend or bearish momentum.
Overbought and oversold levels, marked by the red and green dashed lines, respectively, can serve as a warning that a trend reversal may be imminent. When the JSMO_E line reaches or surpasses the overbought level, it might indicate that the asset is overvalued and could experience a price decline. Conversely, when the JSMO_E line reaches or goes below the oversold level, it can signal that the asset is undervalued and may experience a price increase.
Adjust the input parameters (RSI Period, SMA Period, ROC Period, and ROC Weight) as needed to optimize the indicator for the specific market and time frame you are analyzing.
The JSMO_E indicator is suitable for various markets, including stocks, forex, commodities, and cryptocurrencies. However, its effectiveness may vary depending on the market conditions and time frames used. It is recommended to use JSMO_E in conjunction with other technical analysis tools and methods to confirm potential trade setups and improve overall trading performance. Always conduct thorough backtesting and forward-testing before employing any indicator in a live trading environment.
TASC 2023.03 Every Little Bit Helps█ OVERVIEW
TASC's February 2023 edition of Traders' Tips includes an article titled "Every Little Bit Helps: Averaging The Open And Close To Reduce Noise" by John Ehlers. This code implements the numerical example from this article.
█ CONCEPTS
Using theories from digital signal processing as a starting point, John Ehlers argues that using the average of the open and close as the source time series of an indicator instead of using only the closing price can often lead to noise reduction in the output. This effect especially applies when there is no gap between the current bar's opening and the previous bar's closing prices. This trick can reduce noise in many common indicators such as the RSI, MACD, and Stochastic.
█ CALCULATIONS
Following the example presented in the original publication, this script illustrates the proposed strategy using the Relative Strength Index (RSI) as a test indicator. It plots two series:
RSI calculated using only closing prices as its source.
RSI of the same length as the first, but calculated using the average of open and close prices as its source, i.e. (open+close)/2 .
This script demonstrates that using the average of open and close as the calculation source results in a smoother indicator. To visually emphasize the advantage of this proposed trick, the script's color scheme is sensitive to both the RSI value and the difference between the two RSI data streams.
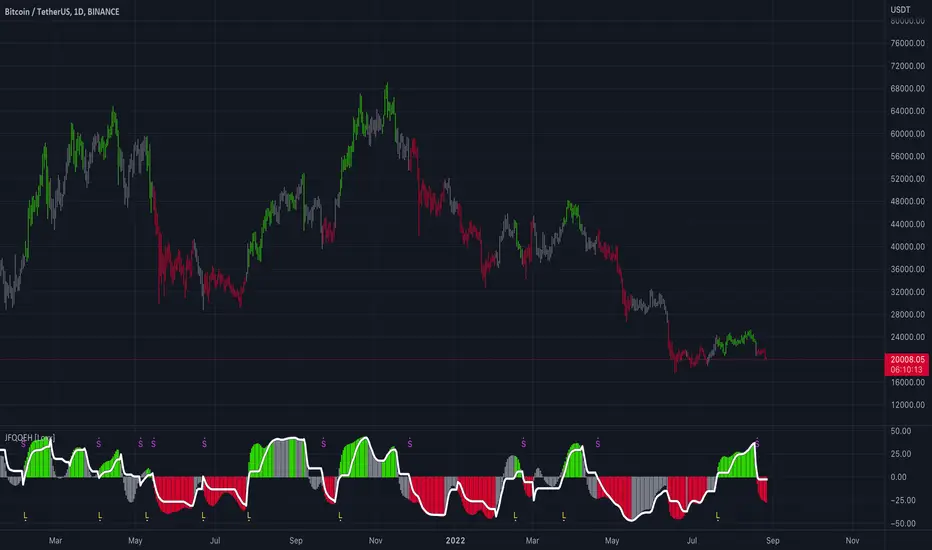
Juirk-Filtered QQE Histogram [Loxx]Juirk-Filtered QQE Histogram is a QQE indicator with 7 different RSI types, Jurik-Filtering with the option of double filtering. 2 types of signals, and Loxx's Expanded Source types. These additions are useful to filter out noise.
What is Qualitative Quantitative Estimation (QQE)?
The Qualitative Quantitative Estimation (QQE) indicator works like a smoother version of the popular Relative Strength Index ( RSI ) indicator. QQE expands on RSI by adding two volatility based trailing stop lines. These trailing stop lines are composed of a fast and a slow moving Average True Range (ATR).
There are many indicators for many purposes. Some of them are complex and some are comparatively easy to handle. The QQE indicator is a really useful analytical tool and one of the most accurate indicators. It offers numerous strategies for using the buy and sell signals. Essentially, it can help detect trend reversal and enter the trade at the most optimal positions.
What is Jurik Volty used in the Juirk Filter?
One of the lesser known qualities of Juirk smoothing is that the Jurik smoothing process is adaptive. "Jurik Volty" (a sort of market volatility ) is what makes Jurik smoothing adaptive. The Jurik Volty calculation can be used as both a standalone indicator and to smooth other indicators that you wish to make adaptive.
What is the Jurik Moving Average?
Have you noticed how moving averages add some lag (delay) to your signals? ... especially when price gaps up or down in a big move, and you are waiting for your moving average to catch up? Wait no more! JMA eliminates this problem forever and gives you the best of both worlds: low lag and smooth lines.
Ideally, you would like a filtered signal to be both smooth and lag-free. Lag causes delays in your trades, and increasing lag in your indicators typically result in lower profits. In other words, late comers get what's left on the table after the feast has already begun.
Included:
Loxx's Expanded Source Types
Alerts
Signals
Bar coloring
Included Libraries
Loxx's Variety RSI
Loxx's Jurik Tools
Loxx's Expanded Source Types
Related indicators:
Natural Market Mirror (NMM) and NMAs w/ Dynamic Zones
RSI/RSX QQE Histogram w/ Discontinued Signal Line
Jurik CFB Adaptive QQE
Adaptive Qualitative Quantitative Estimation (QQE)
Short Term RSI and SMA Percentage ChangeThis strategy utilises common indicators like RSI and moving averages in order to enter and exit trades. The Relative Strength Index (RSI) is a momentum indicator that has a value between 0 and 100, where a value greater than 70 is considered overbought and a value less than 30 is oversold. If the RSI value is above or below these values, then it can signal a possible trend reversal.
The second indicator used in this strategy is the Simple Moving Average (SMA). A SMA is an arithmetic moving average calculated by adding recent prices and then dividing that figure by the number of time periods in the calculation average. For example, one could add the closing price of a coin for a number of time periods and then divide this total by that same number of periods. Short-term averages respond quickly to changes in the price of the underlying coin, while long-term averages are slower to react.
Long/Exit orders are placed when three basic signals are triggered.
Long Position:
RSI is greater than 50
MA9 is greater than MA100
MA9 increases by 6%
Exit Position:
Price increases 5% trailing
Price decreases 5% trailing
The script is backtested from 1 May 2022 and provides good returns.
A trading fee of 0.1% is also taken into account and is aligned to the base fee applied on Binance.
This script also works well on AVAX 45m/1h, MATIC 15m/45m/1h and ETH 4h.

RSI Precision Trend Candles [Loxx]RSI Precision Trend Candles is a candle coloring indicator that uses an average range algorithm to determine trend direction. The precision trend algorithm can be used on any calculated output to tease out interesting trend information.
What is RSI?
The relative strength index (RSI) is a momentum indicator used in technical analysis. RSI measures the speed and magnitude of a security's recent price changes to evaluate overvalued or undervalued conditions in the price of that security.
The RSI is displayed as an oscillator (a line graph) on a scale of zero to 100. The indicator was developed by J. Welles Wilder Jr. and introduced in his seminal 1978 book, New Concepts in Technical Trading Systems.
Included
Bar coloring
Signals
Alerts
Loxx's Expanded Source Types
APA Adaptive Fisher Transform [Loxx]APA Adaptive Fisher Transform is an adaptive cycle Fisher Transform using Ehlers Autocorrelation Periodogram Algorithm to calculate the dominant cycle period.
What is an adaptive cycle, and what is Ehlers Autocorrelation Periodogram Algorithm?
From Ehlers' book Cycle Analytics for Traders Advanced Technical Trading Concepts by John F. Ehlers , 2013, page 135:
"Adaptive filters can have several different meanings. For example, Perry Kaufman’s adaptive moving average ( KAMA ) and Tushar Chande’s variable index dynamic average ( VIDYA ) adapt to changes in volatility . By definition, these filters are reactive to price changes, and therefore they close the barn door after the horse is gone.The adaptive filters discussed in this chapter are the familiar Stochastic , relative strength index ( RSI ), commodity channel index ( CCI ), and band-pass filter.The key parameter in each case is the look-back period used to calculate the indicator. This look-back period is commonly a fixed value. However, since the measured cycle period is changing, it makes sense to adapt these indicators to the measured cycle period. When tradable market cycles are observed, they tend to persist for a short while.Therefore, by tuning the indicators to the measure cycle period they are optimized for current conditions and can even have predictive characteristics.
The dominant cycle period is measured using the Autocorrelation Periodogram Algorithm. That dominant cycle dynamically sets the look-back period for the indicators. I employ my own streamlined computation for the indicators that provide smoother and easier to interpret outputs than traditional methods. Further, the indicator codes have been modified to remove the effects of spectral dilation.This basically creates a whole new set of indicators for your trading arsenal."
What is Fisher Transform?
The Fisher Transform is a technical indicator created by John F. Ehlers that converts prices into a Gaussian normal distribution.
The indicator highlights when prices have moved to an extreme, based on recent prices. This may help in spotting turning points in the price of an asset. It also helps show the trend and isolate the price waves within a trend.
Included:
Zero-line and signal cross options for bar coloring
Customizable overbought/oversold thresh-holds
Alerts
Signals

APA-Adaptive, Ehlers Early Onset Trend [Loxx]APA-Adaptive, Ehlers Early Onset Trend is Ehlers Early Onset Trend but with Autocorrelation Periodogram Algorithm dominant cycle period input.
What is Ehlers Early Onset Trend?
The Onset Trend Detector study is a trend analyzing technical indicator developed by John F. Ehlers , based on a non-linear quotient transform. Two of Mr. Ehlers' previous studies, the Super Smoother Filter and the Roofing Filter, were used and expanded to create this new complex technical indicator. Being a trend-following analysis technique, its main purpose is to address the problem of lag that is common among moving average type indicators.
The Onset Trend Detector first applies the EhlersRoofingFilter to the input data in order to eliminate cyclic components with periods longer than, for example, 100 bars (default value, customizable via input parameters) as those are considered spectral dilation. Filtered data is then subjected to re-filtering by the Super Smoother Filter so that the noise (cyclic components with low length) is reduced to minimum. The period of 10 bars is a default maximum value for a wave cycle to be considered noise; it can be customized via input parameters as well. Once the data is cleared of both noise and spectral dilation, the filter processes it with the automatic gain control algorithm which is widely used in digital signal processing. This algorithm registers the most recent peak value and normalizes it; the normalized value slowly decays until the next peak swing. The ratio of previously filtered value to the corresponding peak value is then quotiently transformed to provide the resulting oscillator. The quotient transform is controlled by the K coefficient: its allowed values are in the range from -1 to +1. K values close to 1 leave the ratio almost untouched, those close to -1 will translate it to around the additive inverse, and those close to zero will collapse small values of the ratio while keeping the higher values high.
Indicator values around 1 signify uptrend and those around -1, downtrend.
What is an adaptive cycle, and what is Ehlers Autocorrelation Periodogram Algorithm?
From his Ehlers' book Cycle Analytics for Traders Advanced Technical Trading Concepts by John F. Ehlers , 2013, page 135:
"Adaptive filters can have several different meanings. For example, Perry Kaufman’s adaptive moving average ( KAMA ) and Tushar Chande’s variable index dynamic average ( VIDYA ) adapt to changes in volatility . By definition, these filters are reactive to price changes, and therefore they close the barn door after the horse is gone.The adaptive filters discussed in this chapter are the familiar Stochastic , relative strength index ( RSI ), commodity channel index ( CCI ), and band-pass filter.The key parameter in each case is the look-back period used to calculate the indicator. This look-back period is commonly a fixed value. However, since the measured cycle period is changing, it makes sense to adapt these indicators to the measured cycle period. When tradable market cycles are observed, they tend to persist for a short while.Therefore, by tuning the indicators to the measure cycle period they are optimized for current conditions and can even have predictive characteristics.
The dominant cycle period is measured using the Autocorrelation Periodogram Algorithm. That dominant cycle dynamically sets the look-back period for the indicators. I employ my own streamlined computation for the indicators that provide smoother and easier to interpret outputs than traditional methods. Further, the indicator codes have been modified to remove the effects of spectral dilation.This basically creates a whole new set of indicators for your trading arsenal."

Adaptive, Jurik-Filtered, JMA/DWMA MACD [Loxx]Adaptive, Jurik-Filtered, JMA/DWMA MACD is MACD oscillator with a twist. The traditional calculation of MACD is the between two EMAs of price. This traditional approach yields a very noisy and lagged signal. To solve this problem, JMA/DWMA MACD uses the difference between adaptive Juirk-Filtered price and adaptive DWMA to yield a marked improvement over traditional MACD.
What is JMA / DWMA oscillator (MACD)?
Of all the different combinations of moving average filters to use for a MACD oscillator, we prefer using the JMA - DWMA combination.
JMA is ideal for the fast moving average line because it is quick to respond to reversals, is smooth and can be set to have no overshoot. DWMA (double weighted moving average) is ideal for the slower line as is tends to delay reversing direction until JMA crosses it.
What is Jurik Volty used in the Juirk Filter?
One of the lesser known qualities of Juirk smoothing is that the Jurik smoothing process is adaptive. "Jurik Volty" (a sort of market volatility ) is what makes Jurik smoothing adaptive. The Jurik Volty calculation can be used as both a standalone indicator and to smooth other indicators that you wish to make adaptive.
What is the Jurik Moving Average?
Have you noticed how moving averages add some lag (delay) to your signals? ... especially when price gaps up or down in a big move, and you are waiting for your moving average to catch up? Wait no more! JMA eliminates this problem forever and gives you the best of both worlds: low lag and smooth lines.
Ideally, you would like a filtered signal to be both smooth and lag-free. Lag causes delays in your trades, and increasing lag in your indicators typically result in lower profits. In other words, late comers get what's left on the table after the feast has already begun.
What is an adaptive cycle, and what is Ehlers Autocorrelation Periodogram Algorithm?
From his Ehlers' book Cycle Analytics for Traders Advanced Technical Trading Concepts by John F. Ehlers , 2013, page 135:
"Adaptive filters can have several different meanings. For example, Perry Kaufman’s adaptive moving average ( KAMA ) and Tushar Chande’s variable index dynamic average ( VIDYA ) adapt to changes in volatility . By definition, these filters are reactive to price changes, and therefore they close the barn door after the horse is gone.The adaptive filters discussed in this chapter are the familiar Stochastic , relative strength index ( RSI ), commodity channel index ( CCI ), and band-pass filter.The key parameter in each case is the look-back period used to calculate the indicator. This look-back period is commonly a fixed value. However, since the measured cycle period is changing, it makes sense to adapt these indicators to the measured cycle period. When tradable market cycles are observed, they tend to persist for a short while.Therefore, by tuning the indicators to the measure cycle period they are optimized for current conditions and can even have predictive characteristics.
The dominant cycle period is measured using the Autocorrelation Periodogram Algorithm. That dominant cycle dynamically sets the look-back period for the indicators. I employ my own streamlined computation for the indicators that provide smoother and easier to interpret outputs than traditional methods. Further, the indicator codes have been modified to remove the effects of spectral dilation.This basically creates a whole new set of indicators for your trading arsenal."
Included
- Toggle on/off bar coloring
